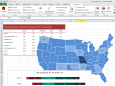
Infographics
OfficeReports Analytics v.6.0
OfficeReports makes it easy to create charts and tables in Excel in the layout you like! No matter if you have your data in Excel or SPSS format, or would like to connect directly to your SurveyMonkey survey. Including statistical analysis!
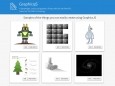
GraphicsJS v.1.2.0
GraphicsJS is a free, open-source JavaScript library for easily drawing any interactive HTML5 graphics and animation. It's lightweight and supports powerful line drawing (curves, arcs...), multiline texts, virtual DOM, smart layering, convenient API.